
Central Bank Trends
Reading the Fed’s pause without over-translating it
A hold is not automatically a cut cycle. Duration positioning should track the path of real rates, not a single meeting statement.
Filter the desk’s notes on the Federal Reserve, inflation, market breadth, and sector leadership — readings of public data used to frame allocation decisions.

No briefs match that search. Try a different keyword or category.
Central Bank Trends
A hold is not automatically a cut cycle. Duration positioning should track the path of real rates, not a single meeting statement.
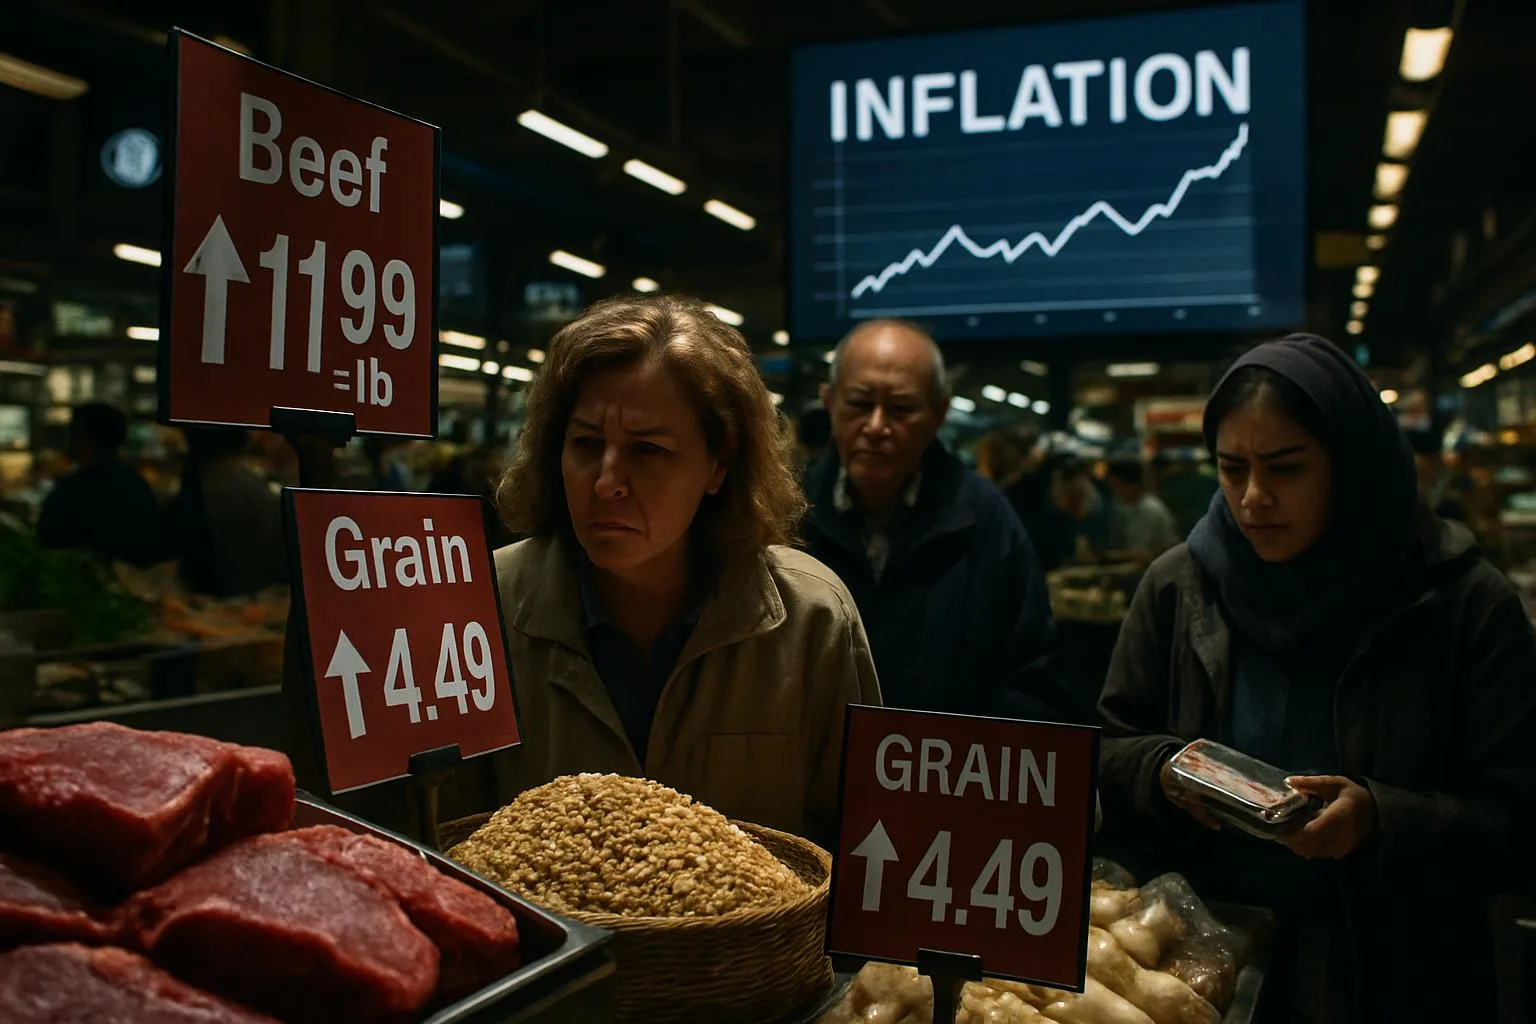
Inflation & Rates
Goods disinflation has done most of the work. Sticky services inflation is what keeps the policy rate from falling as fast as markets sometimes price.

Market Analysis
A healthier advance includes more than a handful of mega-cap names. Watch equal-weight versus cap-weight as a simple breadth check.

Sector Observations
Financials, industrials, and parts of healthcare are adding to the earnings tape. Concentration risk in a few names is easing, not gone.

Economic Indicators
Job openings have come down from extremes while unemployment has only edged higher. That is a soft-landing pattern — until it isn’t.

Risk / Outlook
Growth is decelerating from a strong starting point. The risk is a policy error or a credit event — not that the U.S. economy has already stalled.

Central Bank Trends
Even when the funds rate is on hold, shrinking reserves can keep financial conditions firmer than a “pause” headline implies.
Market Analysis
A less inverted curve eases some pressure on net interest margins, but long-duration assets remain sensitive to any re-acceleration in inflation.

Economic Indicators
Higher-income households still spend on services. Lower-income real wage pressure shows up first in discretionary goods — a useful split for sector work.
Watchlist, not a forecast
A focused set of macro indicators used to frame risk, valuation and portfolio positioning.
Core PCE
Inflation
The Fed's preferred measure of underlying inflation pressure.
Unemployment rate
Labor
Helps distinguish gradual labor-market cooling from a harder slowdown.
ISM / PMI
Activity
A read on manufacturing and services momentum across the economy.
10-year Treasury yield
Rates
A key discount rate for long-duration cash flows and valuations.
Framework for observation, not individualized investment advice.